What is Statistical Process Control (SPC)
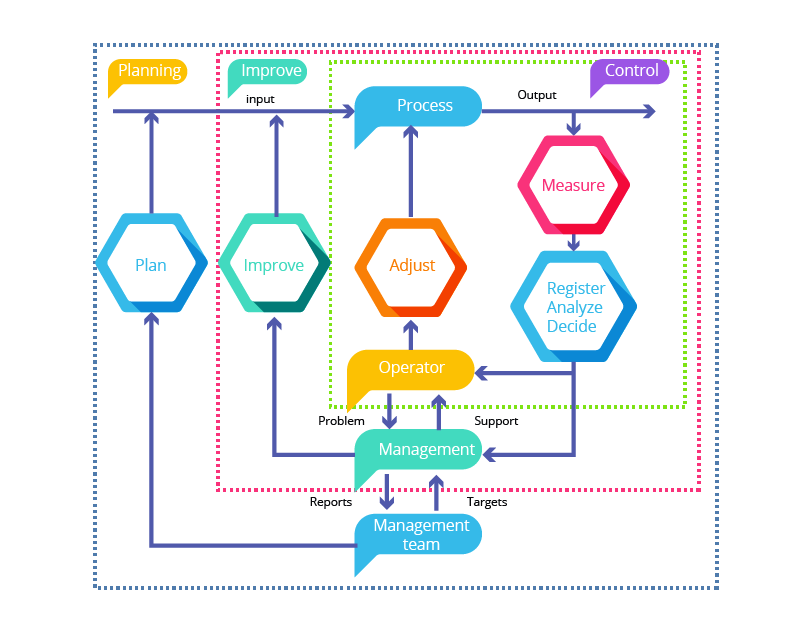
Statistical Process Control (SPC) is a prevention based quality control. By monitoring process performance using statistical tools in a real time, and based on trends and changes in performance, one can sense the forthcoming non-conforming part/product and take suitable action and prevent that.
SPC was used during world war II by US military to ensure quality weapons. Later Japanese used that tool very effectively in their manufacturing to ensure quality and reliable products and could benefit greatly. Today, many industries across the world started using SPC as a quality tool for improved performance. International Automotive Task Force (IATF) made SPC as a mandatory tool to be used by auto components manufacturers and included in QMS standard for automotive industry.
Xbar & R charts
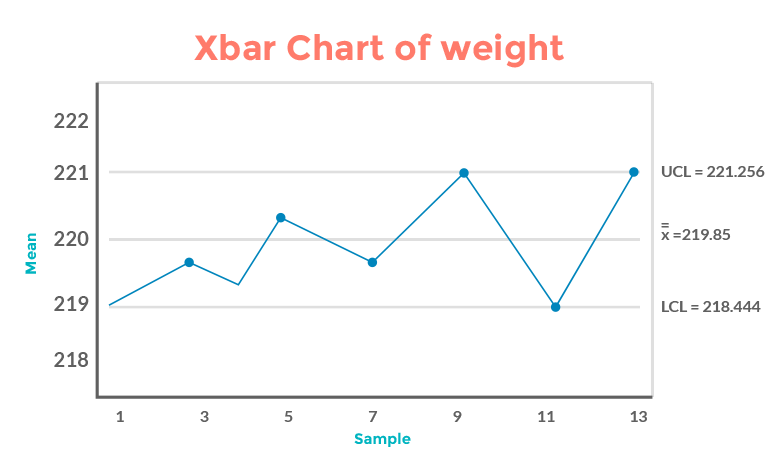
The most popular control charts used in SPC are Xbar & R chart pair. They are used for processes having variable data and have sub-group size of 2 or more (generally less than 10) Data is collected in the form of measurements of the product/part feature (like weight, dimension etc) or process instrument readings. Based on the sub-group size decided for a process, data is collected at fixed time intervals for the subgroup size and used for the control charts preparation.
The Xbar chart presents the mean of each sub-group and shows the variation in the sample means. The Range (R) chart indicates how the data is spread. The Upper Control Limit (UCL) and Lower Control Limit (LCL) are derived using constants (varies with sub-group size) and averages. The quality inspectors who are trained in SPC tool can make out the issues based on trends and data beyond the control limits.
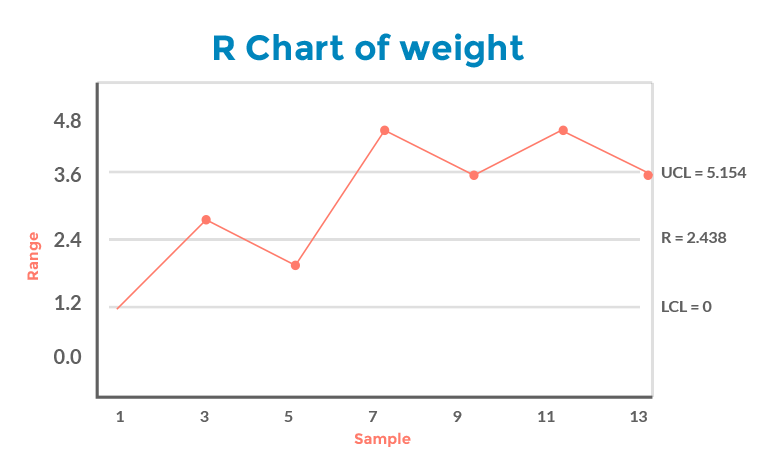
The variations due to common causes will fall between the control limits whereas special causes data will fall out of control limits. A process that is in statistical control, there should not be any special causes. Some level of variation is inevitable for most of the processes and it is called common causes.
Few examples of common causes are -
- Normal machine or tooling wear
- Variation in material properties within specification
- Seasonal changes in ambient temperature or humidity
Some examples of special cause variation include -
- Machine malfunction
- Raw material properties out of design specifications
- Broken tool, punch, bit, etc.
The data within the control limits too can be analyzed and inferences can be arrived based on the trends so that non-conformities can be eliminated. Based on the findings from these charts, one can identify the process issues and address them well in advance to avoid the possible defective parts production. When the process is stable its variation should remain in the known set of limits.
Process Capability - Cp & Cpk
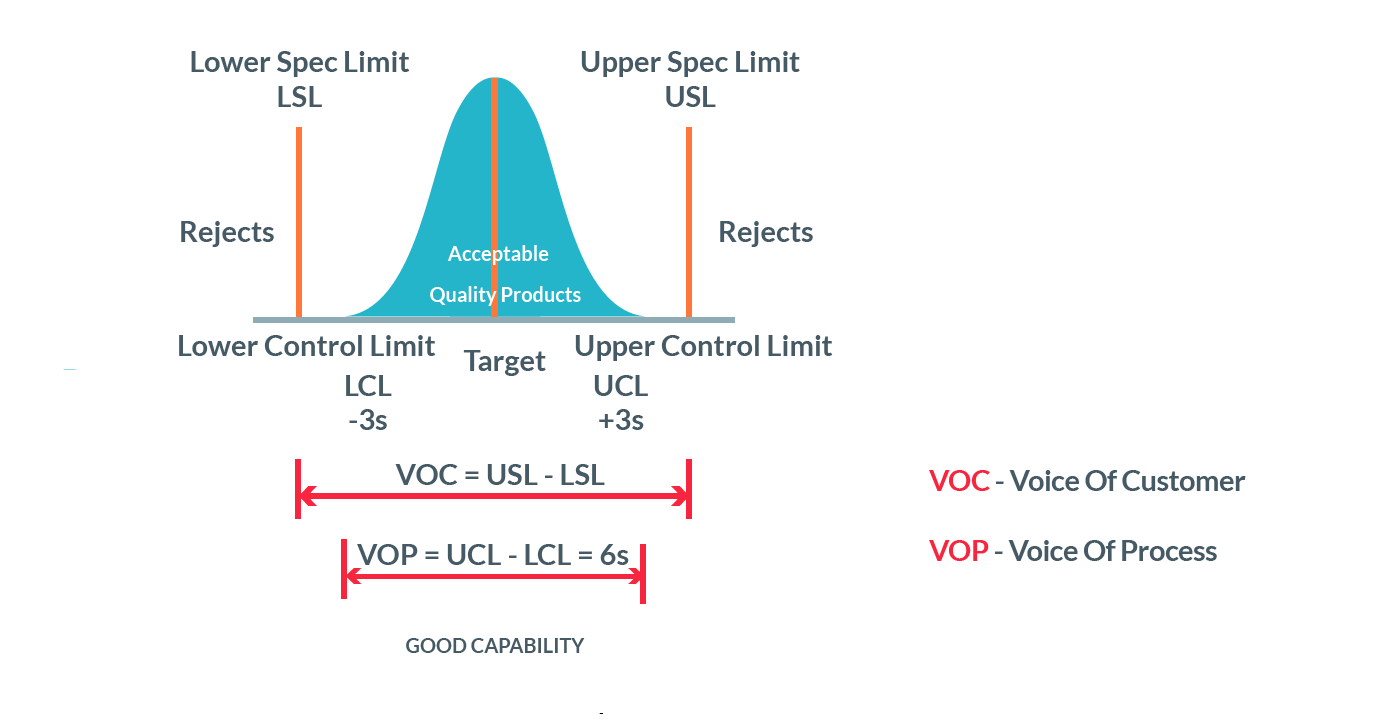
Process Capability is a measurement of how the process is performing with respect to a desired outcome. A capable process is one where almost all the measurements fall inside the specification limits.
Commonly used statistical measures for the capability of a process are - Cp & Cpk.
| Estimated SD | |||
|---|---|---|---|
| Cp | A simple indicator for process variation | Cp = (USL-LSL)/6s | SD = Rbar/d2 Rbar - average ranges of subgroup d2 - constant based on subgroup size |
| Cpk | Adjustment of Cp for the effect of non-centered distribution | k = min of (USL-Xbar)/3s and (Xbar-LSL)/3s | |
Cpk never exceeds Cp. A perfectly centered distribution will have Cpk = Cp . The outcome of a Process Capability study is a single metric, that indicates the ability of a process to produce output which is within required specifications.
Below table explains typical values of Cpk:
| (a) | Cpk < 1.00 | Not capable , poor |
|---|---|---|
| (b) | 1 <= Cpk < 1.33 | Capable with tight control |
| (c) | 1.33 <= Cpk < 1.67 | Mininum preferred by many industries , good |
| (d) | Cpk >= 1.67 | Excellent |